
If you’ve spent any time in the nacelle of a 3MW turbine, you know the sound. It’s not just the hum of generation; it’s the high-frequency whine of a planetary stage screaming for mercy. Marketing departments love to sell “AI-driven predictive maintenance” as a plug-and-play solution to O&M costs, but the reality is a messy, high-frequency data nightmare that most SCADA systems aren’t equipped to handle.
The Problem Nobody Talks About
We talk about MTBF (Mean Time Between Failures) as if it’s a law of physics. It isn’t. It’s a statistical wish. I once spent three weeks on a site in the North Sea where the vibration sensors were reporting “nominal” performance right up until the point where the intermediate shaft bearing decided to turn itself into a metallic slurry.
The issue? The sampling rate. Most legacy vibration monitoring systems poll at intervals that are far too slow to capture the transient “spikes” that precede a catastrophic spalling event. By the time your dashboard turns red, you aren’t doing “predictive” maintenance; you’re performing an emergency organ transplant on a multi-ton component that requires a crane vessel you can’t afford.
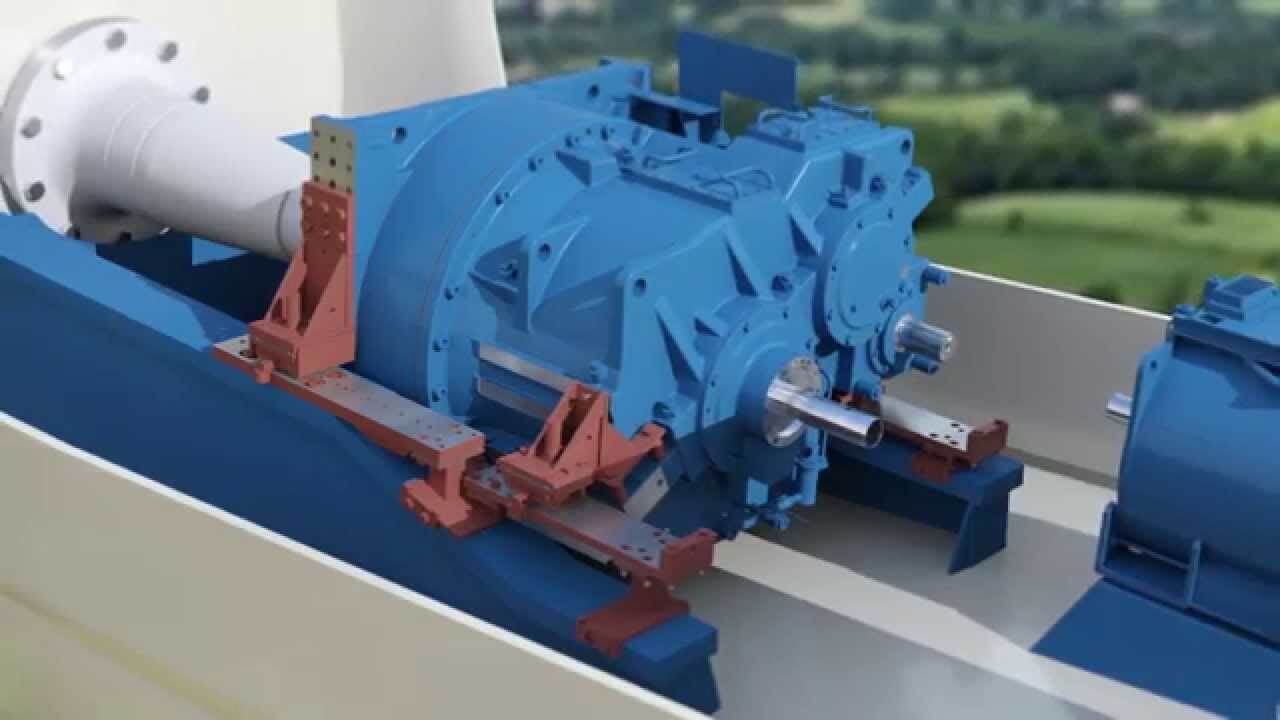 Image Credit: GlobeCore
Technical Deep-Dive
Gearbox failure in wind turbines is rarely a single-event phenomenon. It is a cumulative degradation process driven by non-stationary loading. When you apply FFT (Fast Fourier Transform) analysis to a gearbox, you are assuming a steady state. But wind isn’t steady. It’s chaotic, turbulent, and dynamic.
The Physics of the Failure
When a bearing begins to spall, it introduces a specific frequency signature—the Bearing Defect Frequency. However, in a wind turbine, this signature is masked by the gear mesh frequencies and the structural resonances of the nacelle frame.
If you aren’t using Envelope Analysis (or Hilbert transform-based demodulation), you are just looking at noise. You need to isolate the high-frequency resonance excited by the defect and look for the modulation of that resonance at the lower frequency of the bearing rotation.
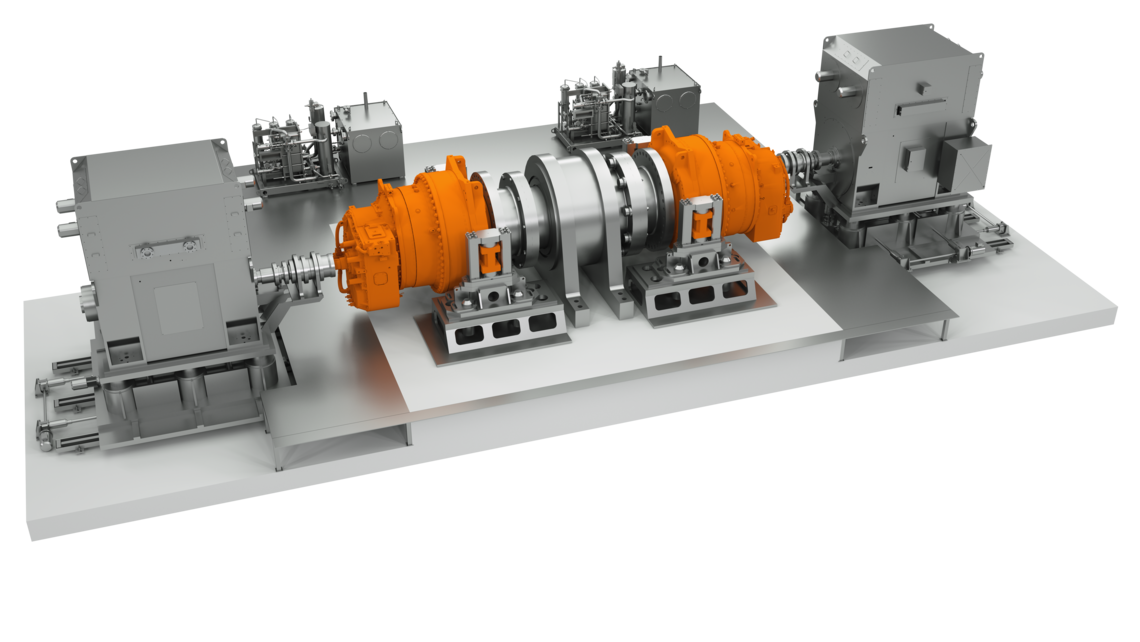 Image Credit: RENK
Implementation Guide
To move beyond the fluff, you need to implement a tiered sensing architecture. Relying solely on vibration is a rookie mistake. You need to cross-correlate vibration data with oil debris monitoring and thermal gradient analysis.
graph TD
A["Sensor Layer"] -->|"Raw Vibration"| B["Edge Processing"]
A -->|"Oil Debris Count"| B
A -->|"Temperature Gradient"| B
B -->|"Feature Extraction"| C["Statistical Model"]
C -->|"Fault Probability"| D["Alert Logic"]
D -->|"Threshold Breach"| E["SCADA Integration"]
- High-Frequency Sampling: You need a minimum of 20kHz sampling rate on your accelerometers to catch the early-stage bearing impacts before they manifest as audible or heat-generating friction.
- Oil Debris Monitoring: Inductive sensors in the oil return line are your best friend. They count metallic particles. If you see a sudden increase in particle count, the gearbox is already dying, regardless of what the vibration sensor says.
- Feature Fusion: Do not trust a single sensor. If your vibration data looks clean but your oil debris sensor is spiking, you have a localized failure that the vibration sensor’s FFT window is missing.
Failure Modes and How to Avoid Them
The most dangerous failure mode is the false negative, where the system reports “Healthy” because the vibration signature is being dampened by a change in oil viscosity or a shift in the load path.
| Failure Mode | Primary Symptom | Mitigation Strategy |
|---|---|---|
| Bearing Spalling | High-frequency impulse | Envelope analysis / Kurtosis tracking |
| Gear Tooth Pitting | Gear mesh frequency sidebands | Order tracking based on rotor RPM |
| Oil Degradation | Increased thermal baseline | Real-time dielectric constant monitoring |
| Shaft Misalignment | 1x RPM harmonic dominance | Phase-shift analysis between sensors |
If you want to understand how these systems interface with the broader grid, check out my previous piece on predictive-maintenance-for-switchgear, where we discuss how to avoid similar sensor-blindness in high-voltage assets.
 Image Credit: MathWorks
When NOT to Use This Approach
Don’t bother with high-fidelity predictive maintenance on small, aging turbines where the cost of the sensor suite exceeds the remaining asset life. If the turbine is due for decommissioning in three years, just perform scheduled oil sampling and call it a day.
Furthermore, if your site lacks a robust energy-management-systems architecture to handle the incoming data stream, you will simply drown in false positives. A system that triggers a technician dispatch every time a gust of wind causes a transient vibration spike is a system that will be ignored by your field team within a month.
Conclusion
Predictive maintenance isn’t a “disruptor”—it’s a high-stakes engineering exercise in signal processing and statistical confidence. Stop buying into the dashboard aesthetic and start looking at the raw data. If you can’t explain the frequency domain peaks you’re seeing, no amount of machine learning is going to save your gearbox from a catastrophic failure. Keep your sensors calibrated, your sampling rates high, and your skepticism higher.
Hero image: A group of wind turbines on a hill.. Generated via GridHacker Engine.


